
Dashboards & Watchlists: The Base Layer for Coverage Management
Turning Research Into Ongoing Context
Most research tools are designed for a single moment in time: you gather information, you write the report, and you ship it.
But that’s not how investment research actually works.
In real workflows, the report is just a snapshot and everything that matters keeps moving after it’s written. Fundamentals shift. Narratives evolve. New filings drop. A competitor announces something that changes the frame. A management comment subtly contradicts what they said two quarters ago. And suddenly the “context” your team had a month ago is stale, fragmented, or trapped inside a PDF no one wants to reopen.
That’s where coverage breaks down. Not because analysts aren’t doing the work, but because the work doesn’t have a persistent home.
So our next stage of product development is centered on what we think is one of the most under-built parts of the entire research stack: a living layer for continuity. Dashboards and watchlists are the base of that layer.
They’re how research becomes ongoing context, instead of a one-and-done output.
Here’s how we’re building our dashboards and watchlists
We’re building the dashboard and watchlist as distinct but connected views inside Strēm. Here’s how we think about it:
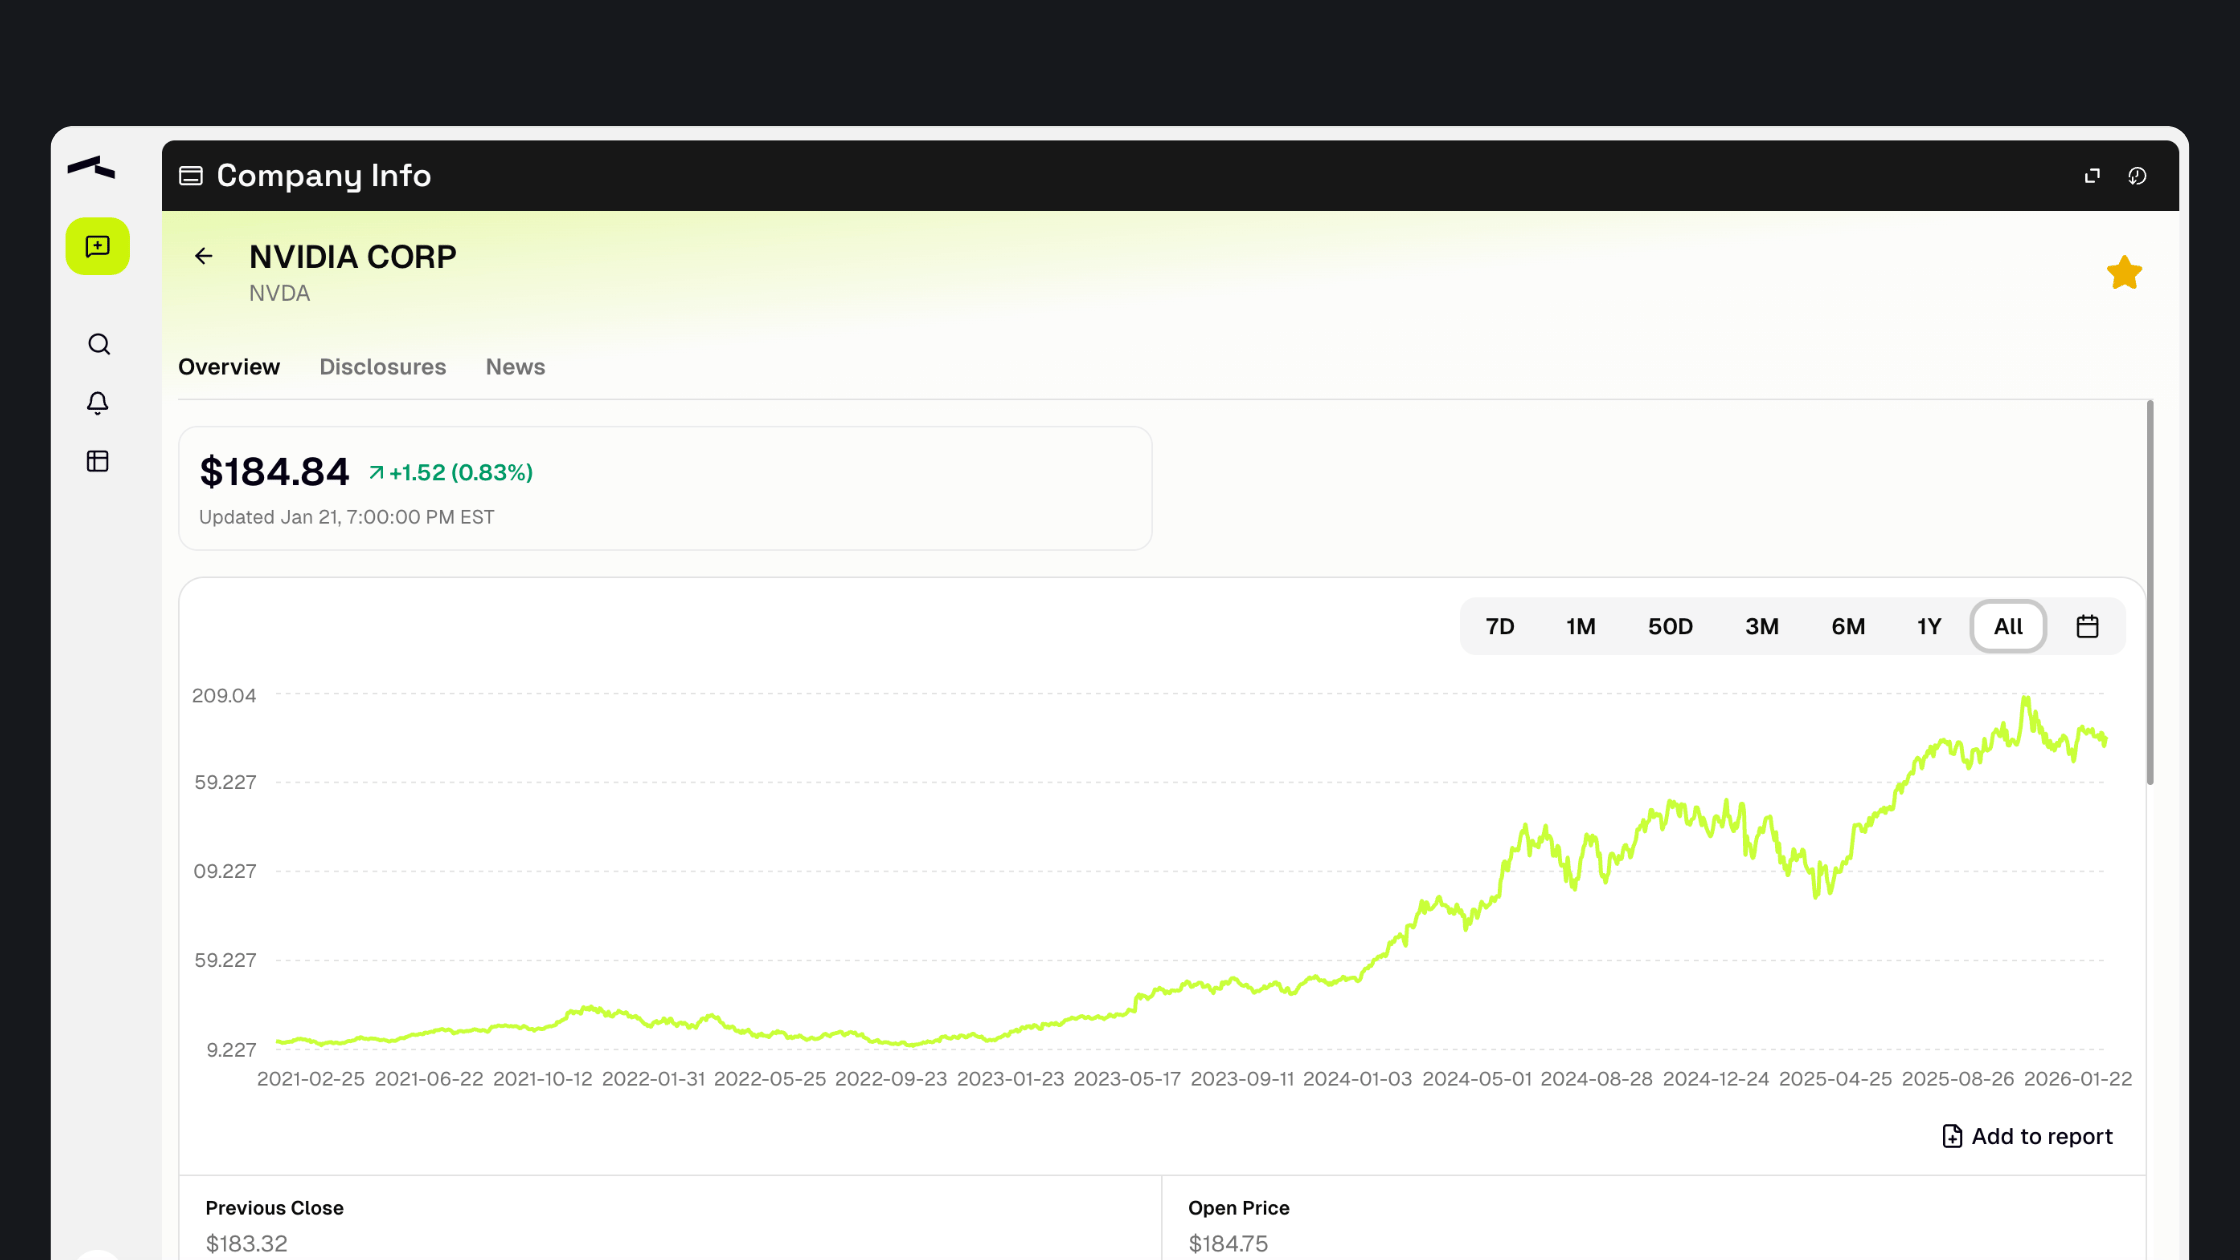
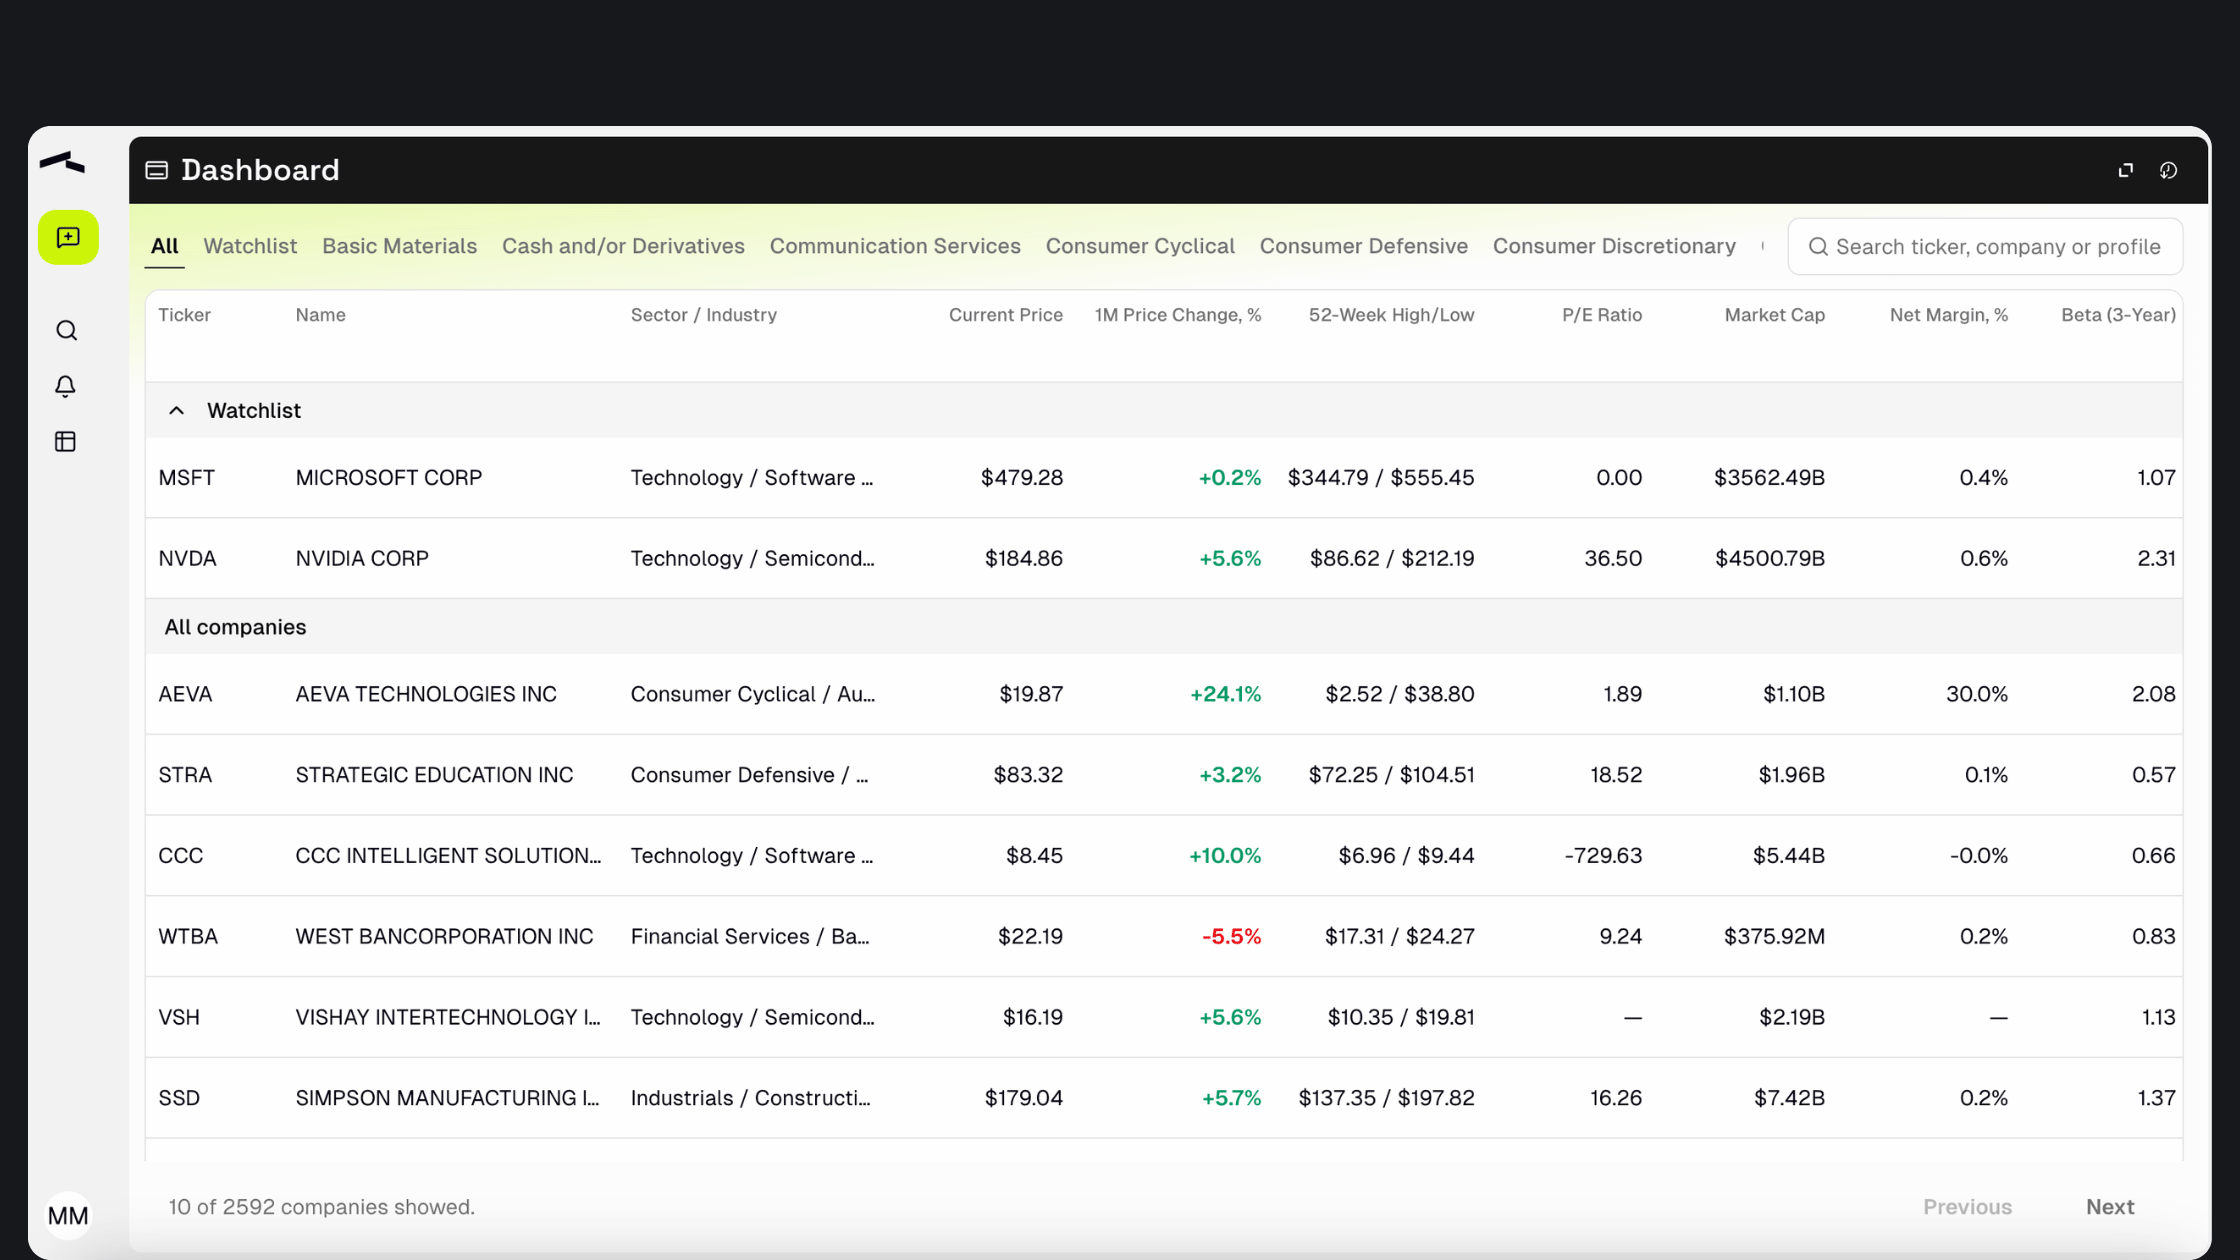
A dashboard is where you go to get oriented at the company level. It’s the place you land when you need to answer: What’s changed? What’s notable? What deserves my attention? It’s a structured view that helps you quickly scan for movement and decide where to dig deeper.
A watchlist is more like your active radar. It’s where you keep the names you’re curious about and the companies you want to monitor while you’re building conviction. Right now these could be the companies in your coverage universe or you could use it to monitor companies that would effect your coverage. Either way, the watchlist gives you an easily place to “keep an eye on this” so that exploration stops being vague and starts becoming an actual monitoring system.
We’re not there yet but eventually we’ll also have coverage management integrated for a third view. It will be designed to be the bridge between “we’ve researched this” and “we’re still confident in our view.” It’s also where drift becomes visible: when a narrative changes, when sentiment shifts, or when fundamentals start moving against the thesis.
Individually, each of these views is useful. Together, they map to how investment teams think and work: awareness → exploration → sustained conviction. That’s the system we’re building with Strēm.
What this unlocks for teams
With dashboards and watchlists in place, teams can keep track of the names and themes that matter without relying on memory, Slack messages, or someone’s personal spreadsheet.
They can monitor updates across research, documents, and signals without having to search from scratch every time.
And they can maintain continuity between analysis, internal discussion, and follow-up, which is where a lot of research workflows often falls apart.
The end goal is to have a living layer of context that supports faster decisions and more consistent conviction.
And it’s a critical step toward what we’re ultimately building: deeper coverage awareness and, eventually, portfolio-aware intelligence.
What’s next
Before we get to coverage management we have a couple of other key features that need to be developed so when we do have coverage, it’s as powerful as it can possibly be. This includes:
News integration
Notifications
Without these 2 features, seeing when shifts and changes happen is all a manual process, meaning important context can be missed that is critical for ratings. Stay tuned!
Curious to see Strēm in action? → Request a demo.